While showroom sales processes such as dealership personnel interaction with customers, working out the deal and vehicle delivery can drive future customer loyalty, higher satisfaction in online and shopping factors can often close a sale, according to the J.D. Power 2019 U.S. Sales Satisfaction Index (SSI) Study,SM released today. Lower satisfaction related to dealership website, inventory and the facility itself is common among brands with lower close rates that perform below segment average in these factors. "While digital retail is on the rise, shoppers aren’t quite ready to adopt an Amazon-like business model when it comes to purchasing a vehicle; they still want to view inventory in-person and often rely on salespeople to explain how the vehicle technology works," said Chris Sutton, Vice President of Automotive Retail at J.D. Power. "In fact, 90% of buyers still visit their selling dealership during the shopping process. The key for dealers is to ensure they don’t lose the sale before a customer even steps foot on their lot. If a new-vehicle shopper isn’t satisfied with the dealer website or facilities, they aren’t going any further in the sales funnel, and that sale is lost before a dealer can demonstrate how well it does everything else. Brands with the highest close-rate percentages are successfully delivering the experiences vehicle shoppers want."
The study identifies several gaps in overall satisfaction below segment averages. Among brands in the luxury segment with lower close rates, the satisfaction gap is 35 points (on a 1,000-point scale) below segment average for dealership website and 73 points lower for facility, which also includes inventory. The gap is less significant, but still exists, in the mass market segment (8 points below the average for website and one point lower for facility). In the luxury rejecter segment, the satisfaction gap is 51 points below the average for facility and 54 points lower for inventory. Among mass market rejecters, there is a 12-point satisfaction gap for facility and a 29-point gap for inventory.
The study finds that nearly one in four shoppers who shop, but don’t buy from a dealer reject that dealer before they even speak with a sales consultant at the dealership. Most of these shoppers are making decisions online. Further, fewer than half of these rejecters even reach the point of negotiating a deal on a vehicle. While the negotiation process is critical, the majority of dealers’ lost sales occur before that process can take place.
Following are some of the key findings of the 2019 study:
- Home/office delivery still requires a thorough experience: While buyers who take delivery of their vehicle at their home or office may appreciate the convenience of this option, they are less satisfied with their vehicle delivery than are those who take delivery at a dealership. While overall satisfaction is fairly even among both groups, delivery satisfaction is lower: 27 points lower among luxury buyers and 10 points lower among mass market buyers. A key reason is that buyers are far more likely to receive explanations and demonstrations of their vehicle’s technology features when taking delivery at their dealership. For instance, dealers demonstrated vehicle safety technology 82% of the time at the dealership, compared with 69% of the time when the vehicle is delivered at a home or office. The takeaway is: regardless of location, customers seek a thorough delivery process, including review of vehicle features and functions.
- In-dealer tech device usage improves satisfaction: In-store usage of tech devices in the vehicle purchase and delivery processes—tablets, dealer personnel’s smartphone, touchscreen monitor or buyer’s smartphone—has increased slightly during the past two years at both luxury and mass market dealerships. Overall satisfaction is 45 points higher when dealers used at least one device than when none were used. Satisfaction is highest among buyers whose dealer demonstrated features either at delivery or when selecting their vehicle. Among devices used, tablets and touchscreen monitors have the biggest effect on overall satisfaction. More than one-third of buyers (36% of luxury and 39% of mass market) indicate that their dealer didn’t use any type of tech device, which represents an area of opportunity for dealers.
- Texting positively influences buying process: The number of buyers who communicate via text message with dealership personnel has increased four percentage points during the past two years. Overall satisfaction among such buyers averages 11 points higher than among those who do not text with dealership personnel. “Dealers should continue to encourage this practice by their staff,” Sutton added. “It improves satisfaction scores and, by getting them into the habit of doing so now, they’ll be better prepared in the future to meet buyers’ expectations when younger, more tech-savvy customers comprise more of the marketplace.”
Sales Satisfaction Study Rankings
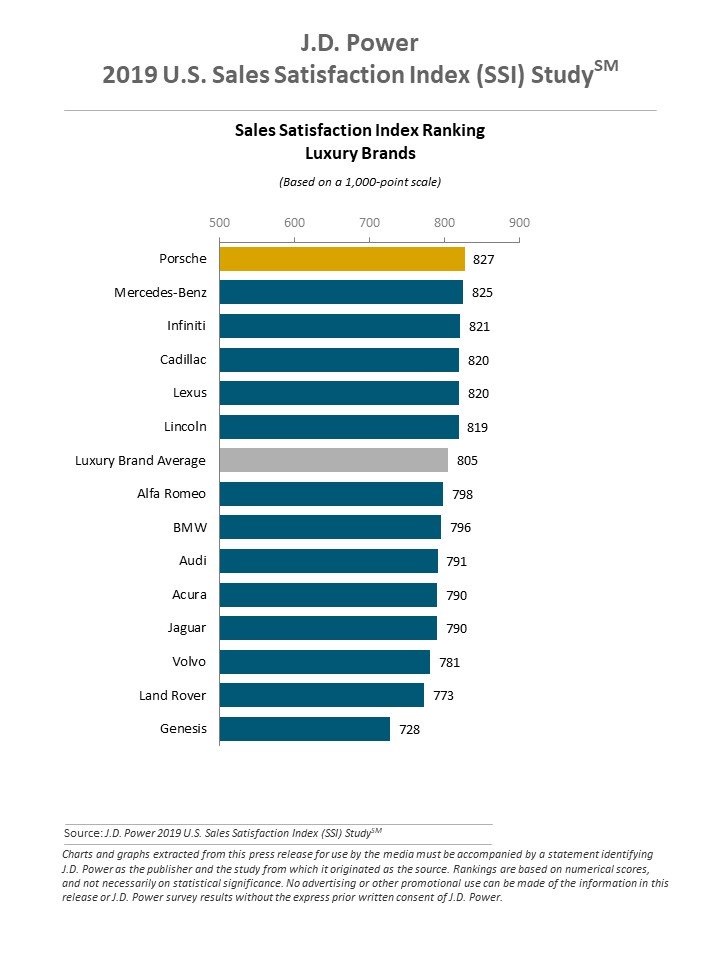
Porsche ranks highest in sales satisfaction among luxury brands, achieving a score of 827. This is the second consecutive year—and the fourth time since 2015—that Porsche has ranked highest. Mercedes-Benz (825) ranks second and Infiniti (821) ranks third.
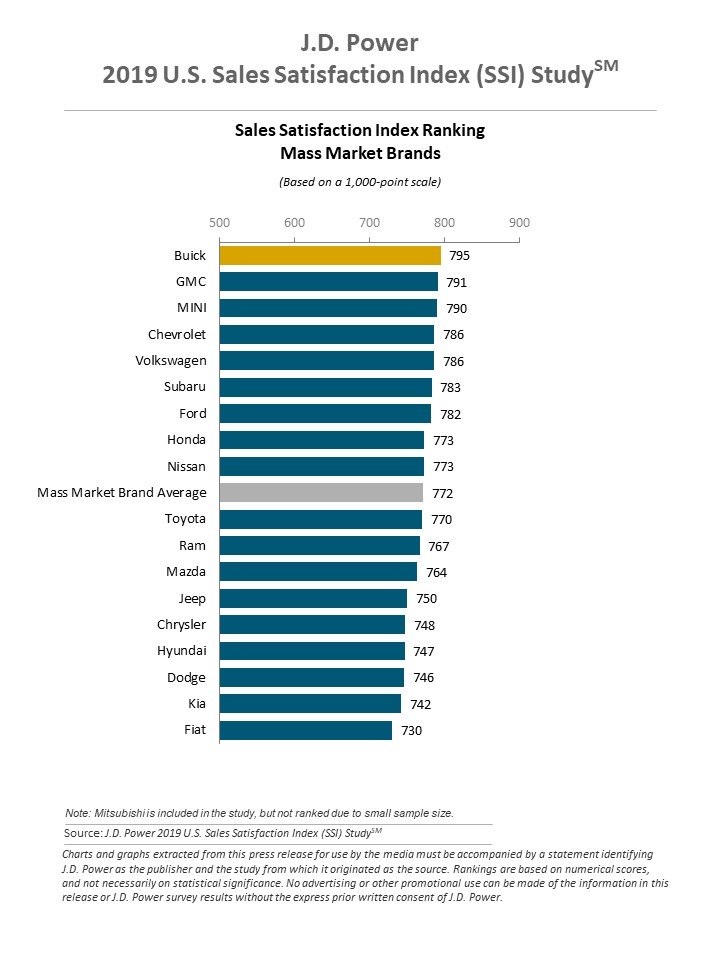
Buick ranks highest in sales satisfaction among mass market brands with a score of 795. This is the third time in four years that Buick ranks highest. GMC (791) ranks second and MINI (790) ranks third.
The U.S. Sales Satisfaction Index (SSI) Study—now in its 33rd year and redesigned in 2017—measures satisfaction with the sales experience among new-vehicle buyers and rejecters (those who shop a dealership and purchase elsewhere). Buyer satisfaction is based on six factors (in order of importance): dealer personnel (28%); delivery process (21%); working out the deal (18%); paperwork completion (16%); dealership facility (13%); and dealership website (4%). Rejecter satisfaction is based on five factors: salesperson (40%); fairness of price (15%); experience negotiating (15%); variety of inventory (15%); and dealership facility (14%).
The study is based on responses from 28,867 buyers who purchased or leased their new vehicle in April-May 2019. The study is a comprehensive analysis of the new-vehicle purchase experience and measures customer satisfaction with the selling dealer (satisfaction among buyers). The study also measures satisfaction with brands and dealerships that were shopped but ultimately rejected in favor of the selling dealership (satisfaction among rejecters). The study was fielded from July through September 2019.
J.D. Power is a global leader in consumer insights, advisory services and data and analytics. These capabilities enable J.D. Power to help its clients drive customer satisfaction, growth and profitability. Established in 1968, J.D. Power has offices serving North America, South America, Asia Pacific and Europe.