Satisfaction scores tend to increase when car dealership service departments use customers’ preferred methods of communication; however, dealerships are not regularly doing so, according to the J.D. Power 2019 Customer Service Index (CSI) Study.SMSatisfaction is 75 points higher (on a 1,000-point scale) among customers who have an all-digital experience compared with one that is all analog, preferring to schedule service via the internet and communicate with the dealer through text messages, rather than doing those tasks via phone. Satisfaction increases further when a service advisor uses a tablet during the service visit.
“Service customers want the convenience that technology offers them,” said Chris Sutton, Vice President, U.S. Automotive Retail Practice at J.D. Power. “For example, 34% of customers indicate they prefer to communicate via text message—but this only occurs 9% of the time! There’s no reason why this isn’t a more widely adopted practice across the industry. Dealers have easy access to these tools, so they don’t have to reinvent the wheel. Technology not only improves efficiency, but also the more satisfied a customer is with their overall service experience, the more likely they are to return to the dealership for service and to recommend the dealership to friends and family members. Customers now expect technology to enable more efficient interaction with businesses—and that includes dealers.”
The study measures satisfaction with service at a franchised dealer or independent service facility for maintenance or repair work among owners and lessees of 1- to 3-year-old vehicles. It also provides a numerical index ranking of the highest-performing U.S. automotive brands, which is based on the combined scores of five different measures that comprise the vehicle owner service experience. These measures are service quality (27%); service initiation (20%); service advisor (20%); service facility (17%); and vehicle pick-up (16%).
Following are key findings of the 2019 study:
- All generations[1] showing a preference for internet scheduling: Customers are slowly shifting their preferred method of scheduling service toward internet scheduling and away from scheduling via phone. In 2015, the industry average preference for these two methods was 20% and 64%, respectively. This year, preferences are 28% and 59%, respectively. While Gen Y customers have shifted their preference toward internet scheduling at a faster rate than have Boomers, every generation (with the exception of Pre-Boomers) has increased its preference for internet scheduling and decreased its preference for phone scheduling during the past five years of the study.
- In-store engagement remains important: The percentage of customers who feel their service advisor provides helpful advice is 70 points higher when the advisor was focused on them and their needs during the visit. This, along with informing customers about work performed on the vehicle (+44); knowing the vehicle’s service history (+37); keeping them informed of the vehicle’s status (+33); letting them know when the vehicle will be ready before service begins (+30); and performing a vehicle walk-around (+30), boosts a customer’s view of the service advisor’s perceived helpfulness.
- A large percentage of owners are also promoters: Net Promoter Score®[2], a metric introduced in the 2018 study that measures customer loyalty and predicts business growth, continues to show that a large number of owners are promoters of their vehicle, although the percentage decreases slightly as vehicles age. Customers are asked their likelihood of recommending their vehicle model on a 0-10 scale and are grouped into either the detractor (0-6), passive (7-8) or promoter (9-10) categories. More than three-fourths (77%) of owners are promoters in year one of vehicle ownership; 75% are promoters in year two; and 73% are promoters in year three. Most notably, when an owner’s vehicle is not fixed right the first time, NPS scores drop approximately 50 points (on a 100-point scale).
- Satisfaction gap closing: Overall satisfaction with services performed by independent facilities has improved 22 points since 2017, compared with a 17-point improvement by franchised dealers. Similarly, satisfaction with service quality at independent facilities has improved 23 points since 2017, compared with a 17-point improvement by franchised dealers.
“This is an important area of opportunity for dealers,” Sutton said. “Seemingly simple things like completing service right the first time; returning settings to how they were when the customer brought the vehicle in for service; and washing the customer’s vehicle—all three of which are Key Performance Indicators (KPIs)—can affect their perception of service quality. While completing repairs right the first time is done 94% of the time, the other two KPIs are only being completed 81% and 45% of the time, respectively. These basics are really building blocks to cementing the customer’s relationship with their dealer.”
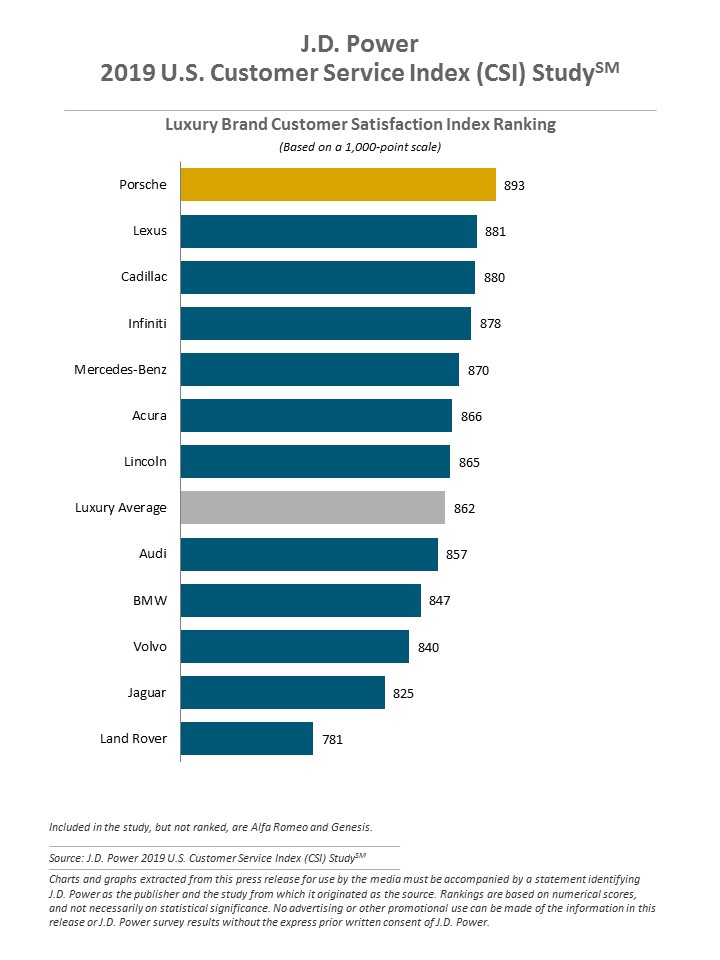
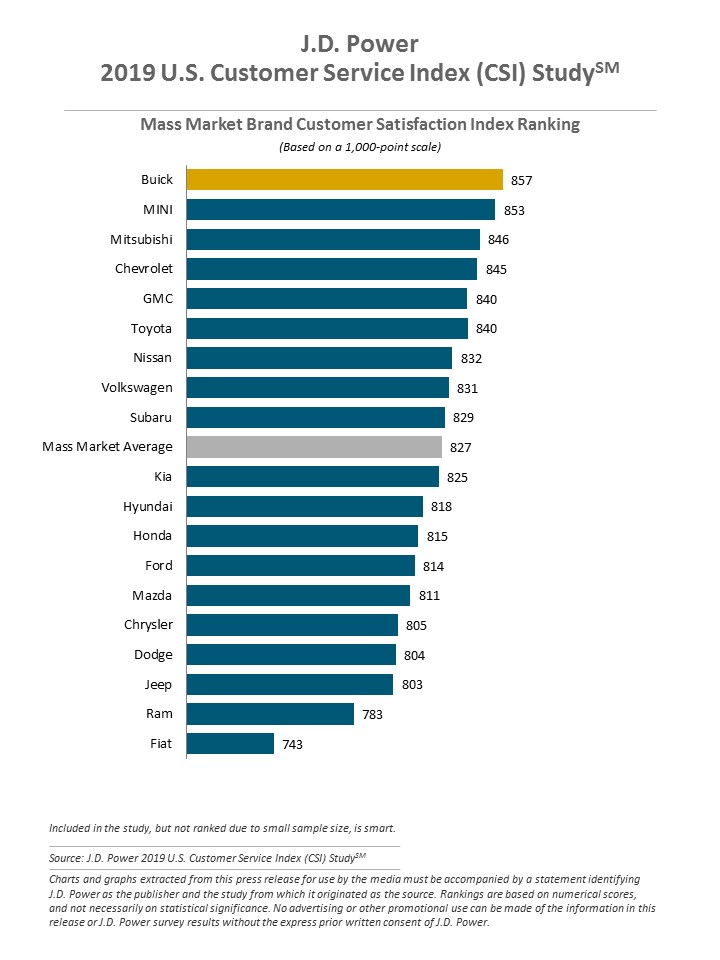
Highest-Ranked Brands
Porsche (893) ranks highest in satisfaction with dealer service among luxury brands for the first time in the study’s 38-year history. Lexus (881) ranks second, followed by Cadillac (880), Infiniti (878) and Mercedes-Benz (870).
Buick ranks highest in satisfaction with dealer service among mass market brands for a third consecutive year, with a score of 857. MINI ranks second (853), followed by Mitsubishi (846), Chevrolet (845), GMC (840) and Toyota (840).
The 2019 U.S. CSI Study is based on responses from 57,286 owners and lessees of 2016 to 2018 model-year vehicles. The study was fielded from October through December 2018.